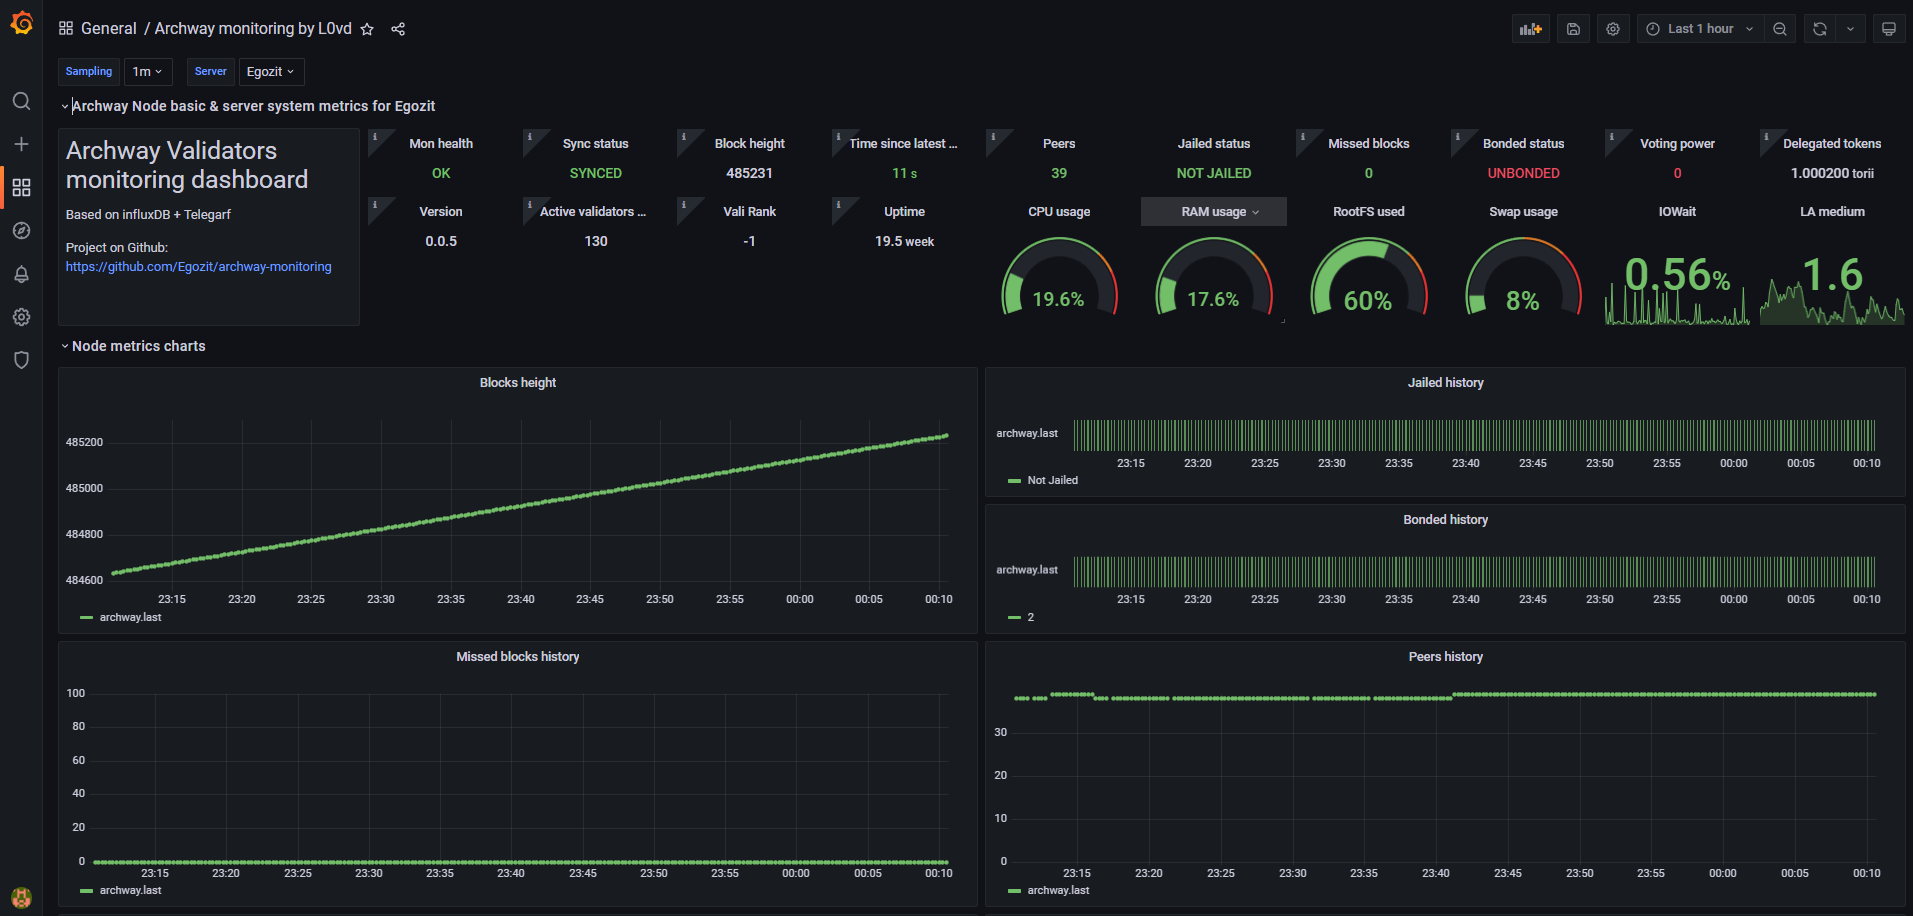
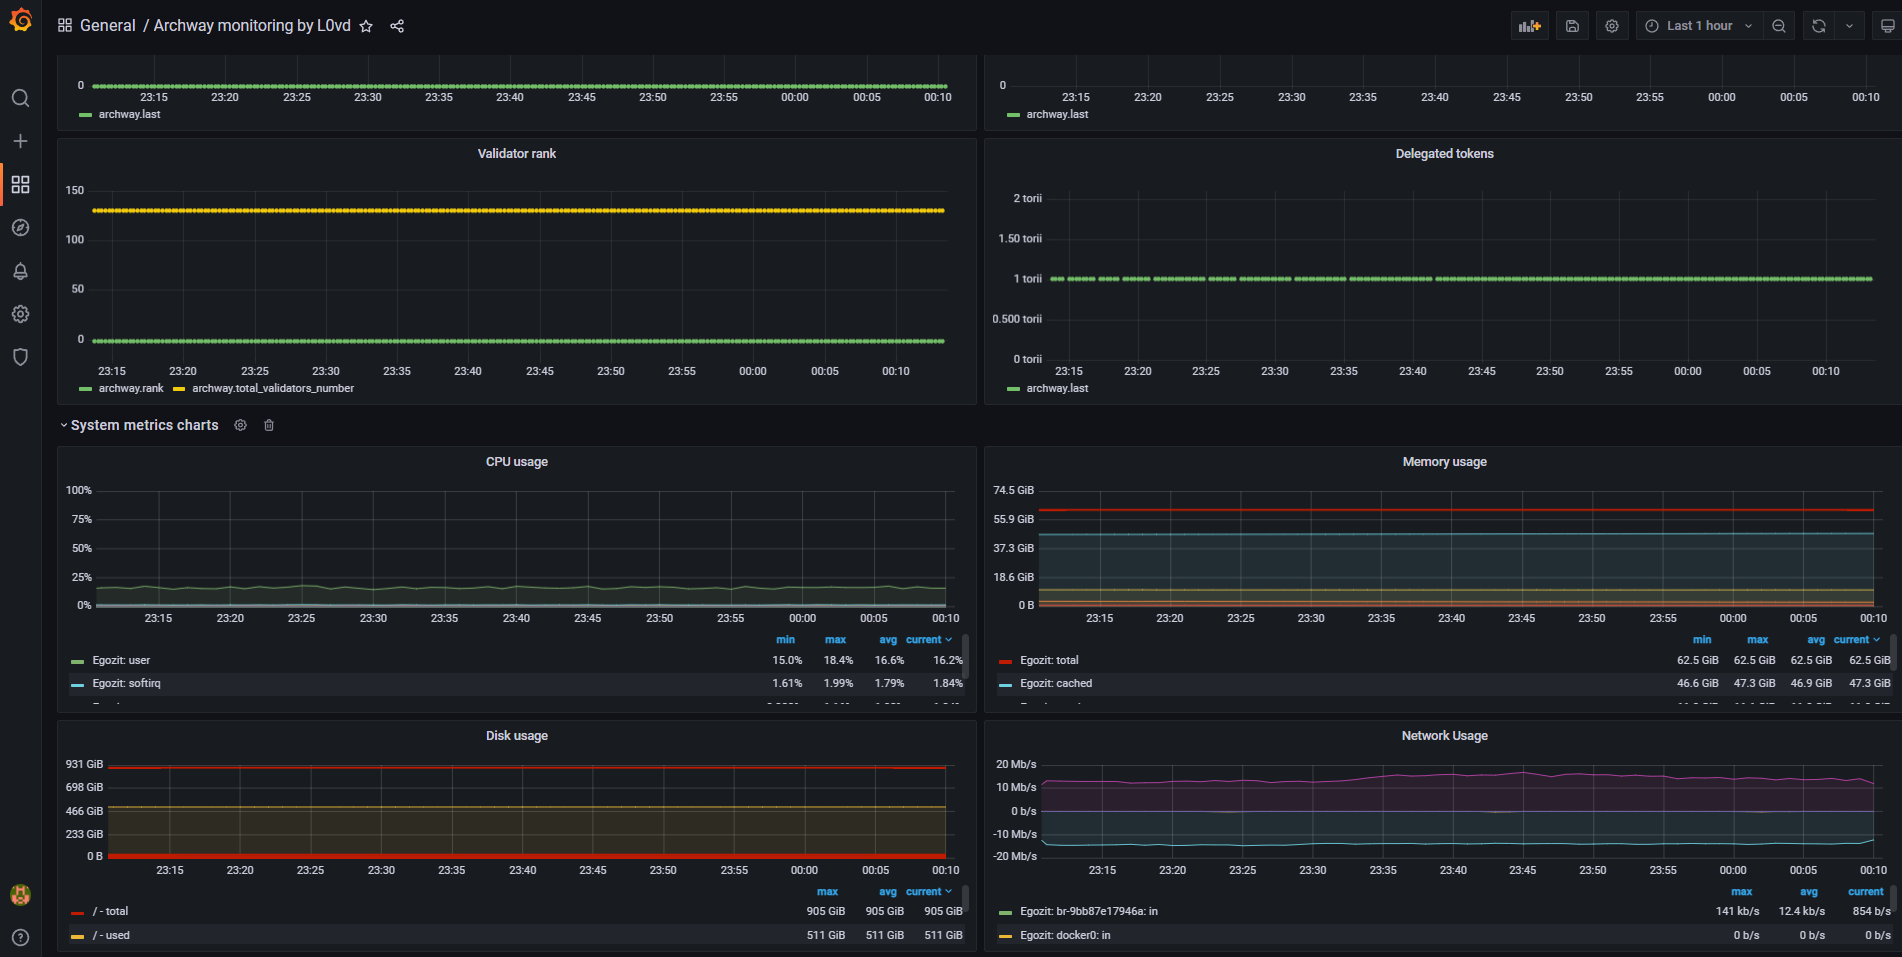
Advantages of using our free service:
Our monitoring service is working on dedicated server (24/7 online)
No need to install database (InfluxDB)
No need to install and configure Grafana Dashboard
On Grafana dashboard you will find all necessary metrics of your node (we use this monitoring service by ourselves, so we've configured dashboard properly)
One line installation:
Copy . <(wget -qO- https://raw.githubusercontent.com/L0vd/chain-services/main/mainnets/bitcanna/monitoring/bitcanna-monitoring-install.sh) OR Manual installation of telegraf and monitoring script
Install telegraf
Copy sudo apt update
sudo apt -y install curl jq bc
# install telegraf
wget https://dl.influxdata.com/telegraf/releases/telegraf_1.14.1-1_amd64.deb
dpkg -i telegraf_*.deb
sudo systemctl enable --now telegraf
sudo systemctl is-enabled telegraf
# make the telegraf user sudo and adm to be able to execute scripts as bitcanna user
sudo adduser telegraf sudo
sudo adduser telegraf adm
sudo -- bash -c 'echo "telegraf ALL=(ALL) NOPASSWD:ALL" >> /etc/sudoers' You can check telegraf service status:
Status can be not ok with default Telegraf's config. Next steps will fix it.
Get files from this project repo and copy variable script template
Insert your parameters to variables.sh :
full path to bitcanna binary to COS_BIN_NAME ( check which d)
node PRC port to COS_PORT_RPC ( check in file path_to_bitcanna_node_config/config/config.toml)
node validator address to COS_VALOPER ( like valoper********)
Save changes in variables.sh and enable execution permissions:
Create telegraf service for bitcanna-mainnet-node monitoring
Edit telegraf configuration
Restart telegraf service
Dashboard interface
Dashboard has main cosmos-based node information and common system metrics. There is a description for each metric.
Go to our comunity dashboard and select you node from the server list:
Complex parameter can show problem concerning receiving metrics from node. Normal value is "OK"
Node catching_up parameter
Latest blockheight of node
Time since latest block
Time interval in seconds between taking the metric and node latest block time. Value greater 15s may indicate some kind of synchronization problem.
Number of connected peers
Validator jailed status.
Number of missed blocks in 10000 blocks running window. If the validator misses more than 500 blocks, it will end up in jail.
Validator stake bonded info
Validator voting power. If the value of this parameter is zero, your node isn't in the active pool of validators
Delegated tokens
Number of delegated tokens
Version of d binary
Your node stake rank
Active validator numbers
Total number of active validators
Other common system metrics: CPU/RAM/FS load, etc.
No comments needed
Last updated 3 months ago

